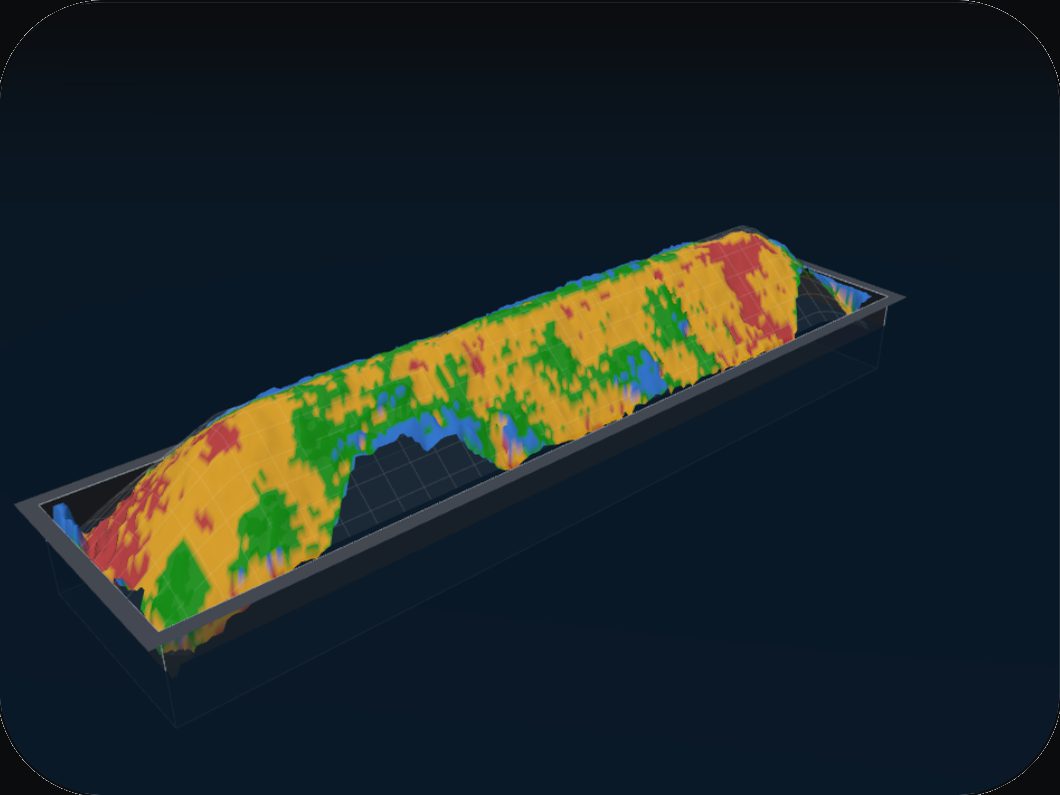
We scanned loaded barges at a BC reload. Each one sailed with room to spare: between 4% and 9% of its rated capacity. From the dock, a full barge and a 91% barge look the same.
93%Average fill, by our scansOur scanned volume against the rated capacity on the certified scale sheet.
650 m³Most empty space on one barge8% of its capacity, about 115 units. Another barge left 9%.
How it works
See the empty space you can still fill in
Two scanners over the hold map the whole load while you pour.
The loader sees how full the barge is, how much is left, and which spots are low.
When the barge is done, you get its volume and a 3D record of the load.
A real load, scan by scan
shortnearlyon targetover
Drag to look around
Same loader, more in the barge
How you pour decides how much fits. We simulated one barge loaded different ways, using its real shape and the slopes we measured on its load.
How you pour
In the barge
Extra
Steady back-and-forth at one speed
6,000 m³
–
Separate piles, then fill between them
6,310 m³
+310 m³
Guided: slow over low spots, skim past full ones
6,650 m³
+650 m³
Guided, with faster winching
6,690 m³
+690 m³
Let it settle overnight, then top up
–
+410 m³On top of the load it would otherwise sail with.
Simulation, not a field result. Each run stops at the first spill and leaves out the final trim, so real loads go higher. What you gain depends on your loader, winch and dock.
Rough math
Fill to a practical 97% and the same material needs fewer sailings.
Not a saving. Crew, dock time and weight limits are left out. It shows the room you can work against, measured on every load.
We make it work. Then we stay until it pays.
First
It works
We install the scanners and make sure the readings match your own scale. That part we guarantee.
Then
It pays
We stay with your crew until the gain is real: fewer sailings, faster loading, a mass balance you can see.
25 minutes with our founder. We walk through a real load, scan by scan.
How we measured. Rated capacity and the certified figures come from the independent scaler's reports for each barge. Our figures come from two LiDAR scanners over the hold, read after loading. Our scans read 1–4% below the scaler's own volume, so the scaler would put the empty space at 3–6%. Volumes are in BC units: 1 unit = 200 ft³ = 5.66 m³.