

It is widely known that material hauled by truck settles over time, as air trapped between the pieces works out and the load packs down on its own. Barges hold far more material, yet get less attention. In normal practice, a barge load is measured once, often at the end of loading, and that number is treated as a certified measurement. If the load keeps changing for hours afterwards, the time of that single measurement decides what it reports.
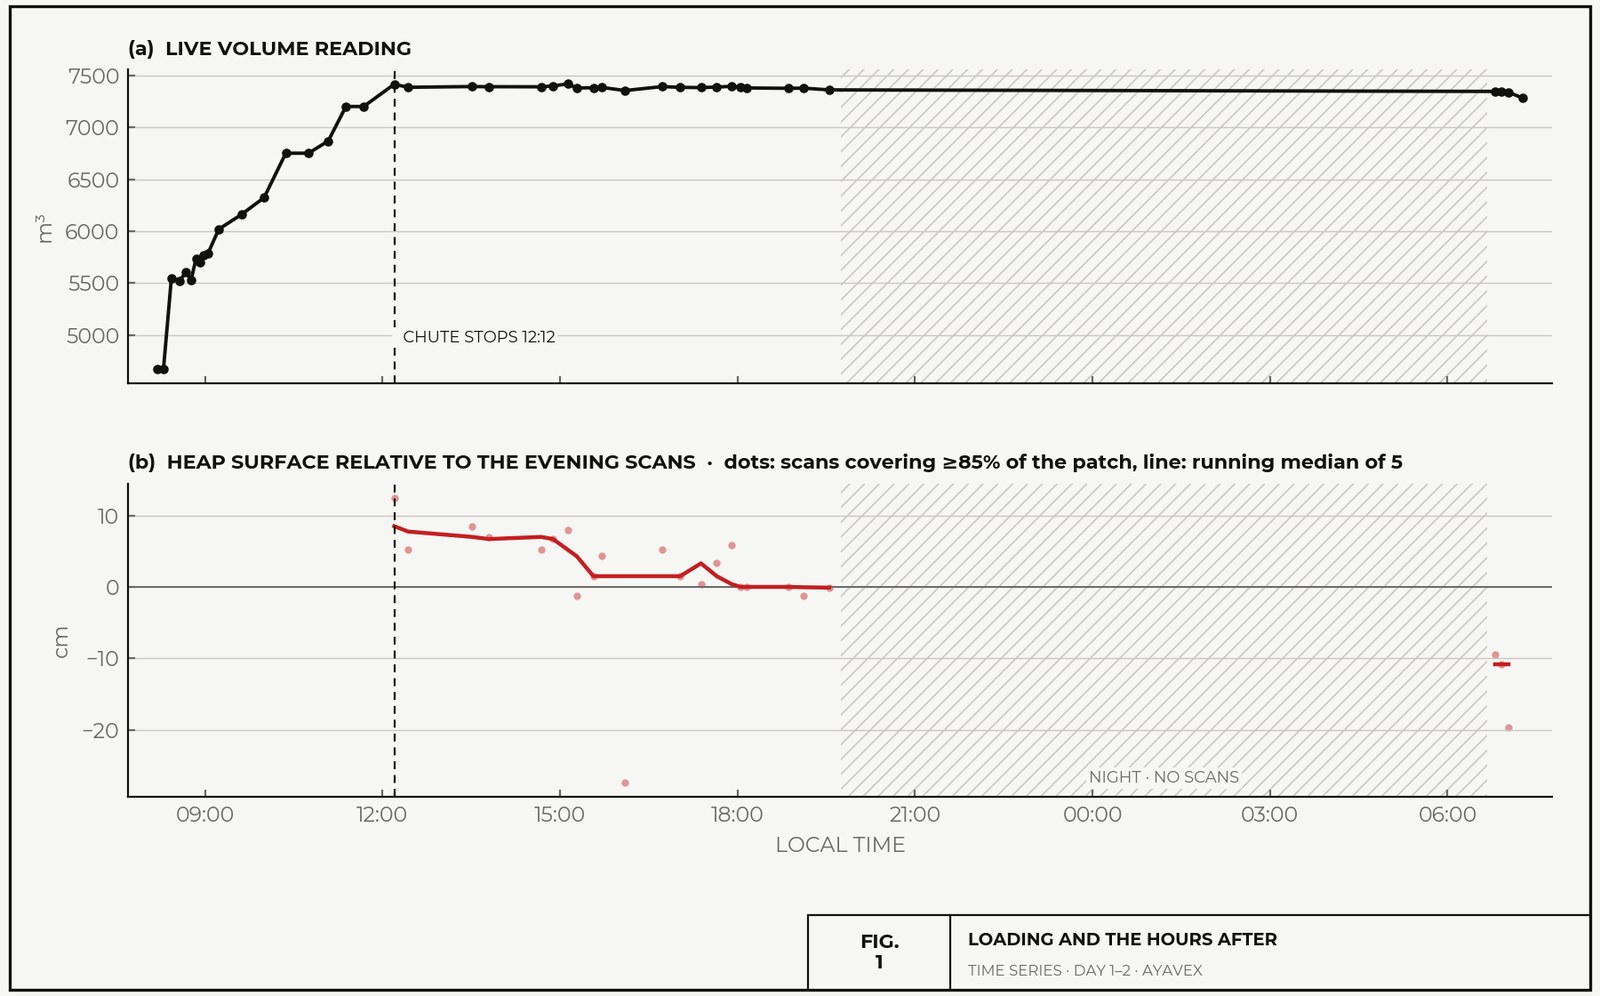
We scanned one loaded woodchip barge continuously over a day to see how big that change is. After the chute stopped, nothing was added or removed, yet the heap surface kept dropping: about 8 cm by evening and another 8 cm overnight, most of it along the crest. That is roughly 2% of the chip depth, or 75–150 m³ on this load. A measurement taken at the end of loading and one taken the next morning can both be correct. By morning, the barge is carrying a denser load.
1. The measurement
Two LiDAR scanners are mounted on the loading structure, about 16 m above the deck and 7.4 m apart, each looking along the barge in the opposite direction. Each scan gives a full 3D surface of the load, which the system turns into a live volume reading. On this load the chute ran from about 08:00 to 12:12. The scanners kept running through the afternoon and evening, paused overnight, and scanned again from 06:45 the next morning. Nothing was added or removed after the chute stopped, and it did not rain.

2. Where it settled
Fig. 2 compares the evening scans with the next-morning scans. The hatched end of the barge is the part that was left out of view the next morning, because of where the barge was parked the night before. With no “before” surface there, it is left out rather than estimated.
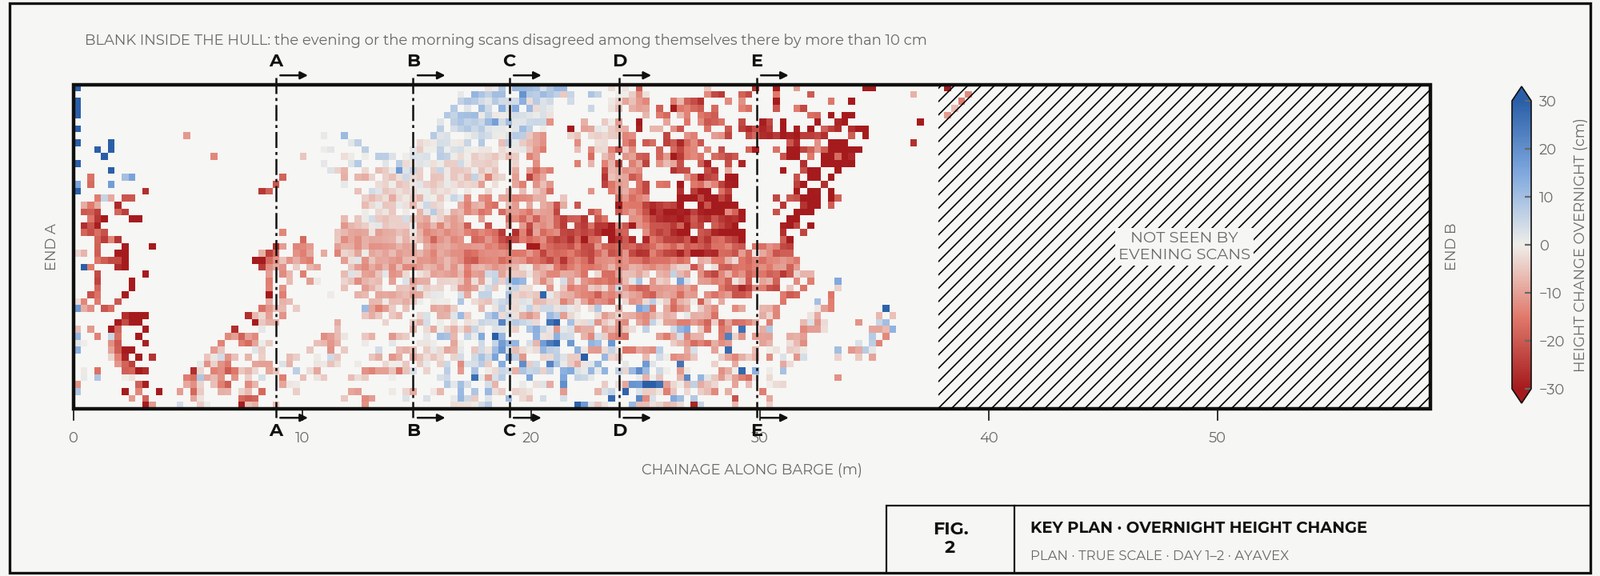
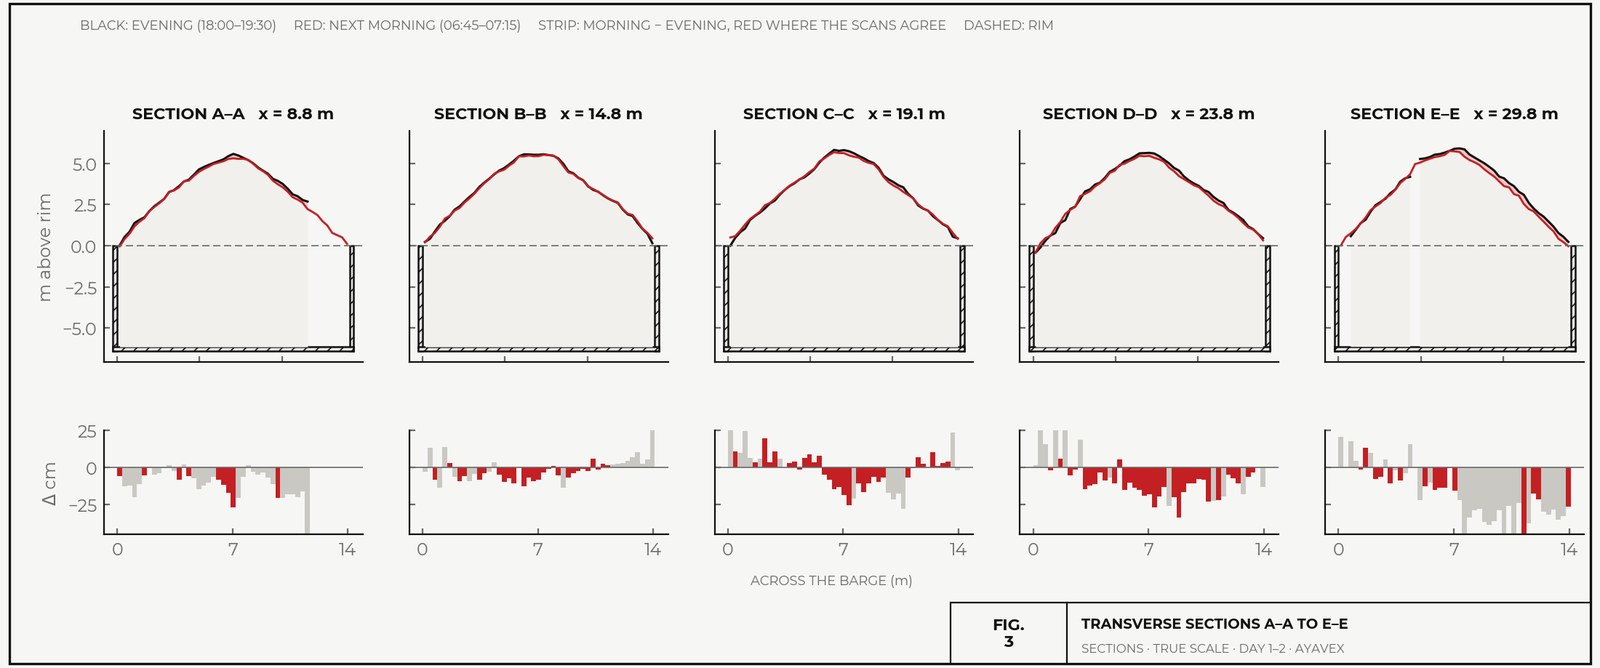
The pattern is the signature of consolidation, not of a measurement shift. A shift would move the whole surface by the same amount. Instead, the drop is largest along the crest, where the chips are deepest, and close to zero on the shallow flanks against the hull walls. A drop of 10–25 cm, on a heap that stands 5.5 m above the rim over a 6 m deep hold, is too small to see from the dock, but well within what the scanners detect.
3. Why it happens
Chips reach the barge by conveyor and chute. Material that falls and piles up, rather than being placed, comes to rest loosely: chips bridge against one another at odd angles and trap pockets of air. Over the following hours, chips slide into the gaps and lie flatter, and the same chips take up less space. Bulk density is therefore not a fixed property of the material. It depends on how the material was deposited and how long it has had to settle.
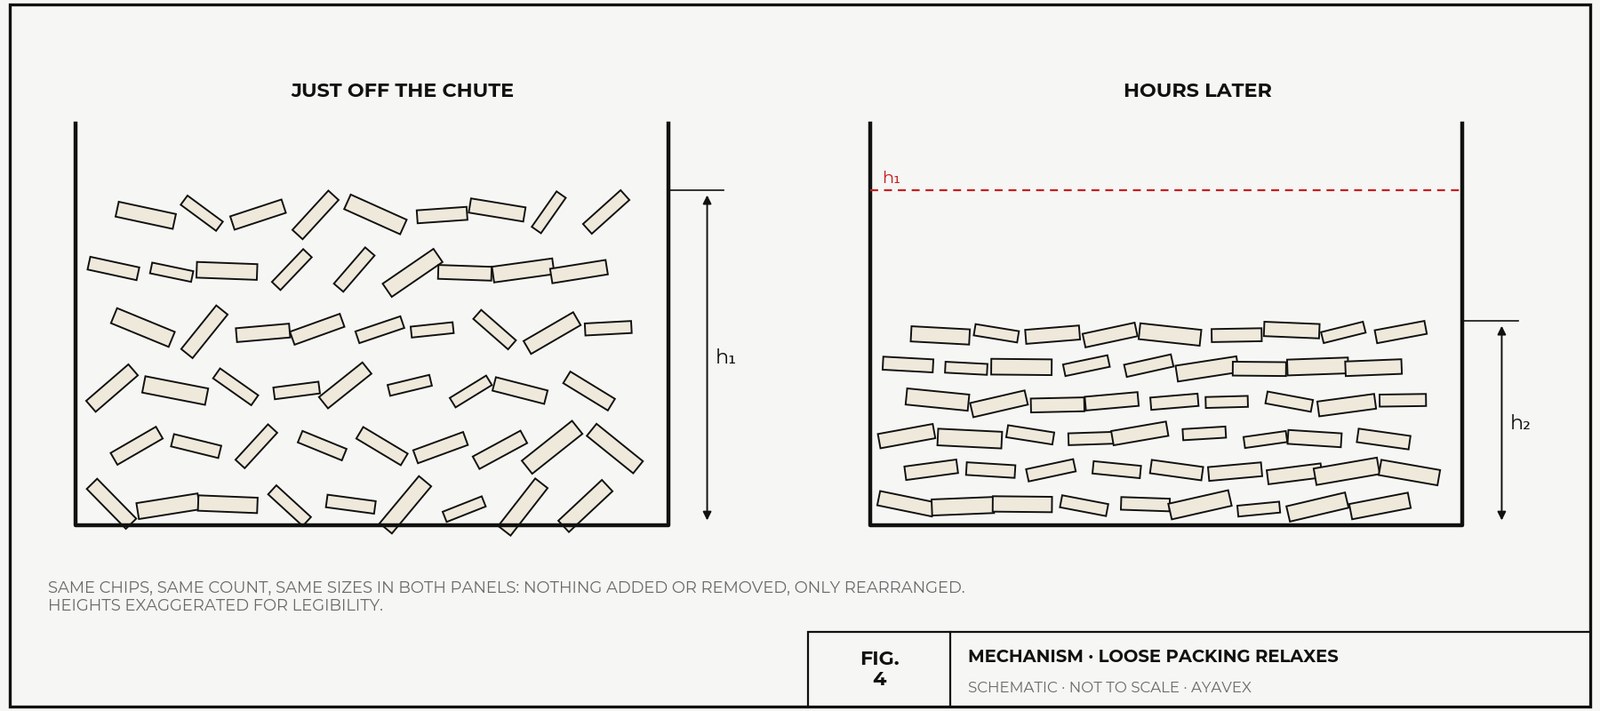
The timescale points to which kind of settling this is. A pile at rest, compacting under its own weight, is slow: laser surveys of four 240 t outdoor chip piles found only 3–6% volume shrinkage over 5.5 months, and driving a 14 t tracked machine over them barely raised their density [1]. Freshly deposited chips that are disturbed are fast: in laboratory tests, 4 minutes of vibration with no added load raised the bulk density of chips and chunks by about 17–24% [3].
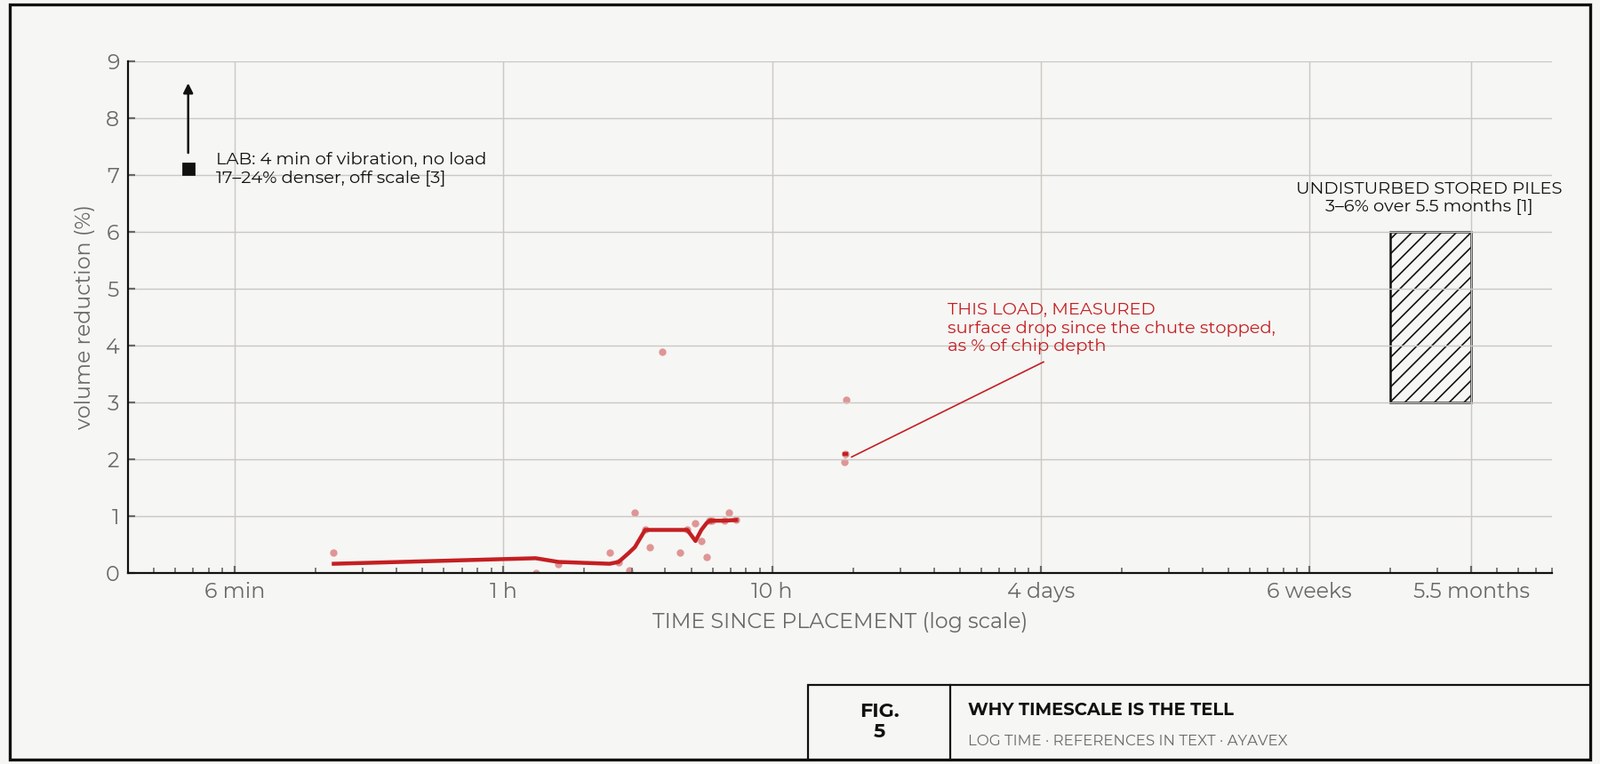
This load reached about 2% within a day, a pace a resting pile takes months to approach. That points to the fast pathway: a loose, freshly loaded heap relaxing as wind, water and the barge’s own small movements at the dock nudge it. The barge has no engine, so that disturbance was mild. How much of the settling came from the heap’s own weight and how much from the disturbance is still an open question.
The same physics shows up at a larger scale elsewhere. At Klintehamn port in Sweden, 6,000 m³ of chips measured loose on the delivery trucks was not enough to fill a 5,720 m³ ship’s hold, which implies at least about 5% compaction during loading. The study’s authors used 12% in their model and cite earlier work finding barge loads about 25% denser than the same chips in trucks [2]. Those figures cover the whole journey from truck to hold. What we measured is the tail end: the settling that continues after the chute stops.
4. What it means
When you measure matters. A survey taken as the chute stops and one taken the next morning can disagree by 1–2%, and both can be correct. Any comparison between measurement methods should record when each was taken, because part of a gap that size can simply be the load changing in between. Across all measurements that we have made, our scans agreed with certified manual scaling to within 0.8–3.7%; settlement on this scale is one reason two honest measurements of the same barge can differ.
Settlement creates room. If the chips sink 1–2% after the chute stops and the barge is still at the dock, there is space for that much more material on the same trip: on this load, 75–150 m³. A live reading shows the settled surface and where the room opened up, along the crest. Whether a top-up pays off depends on the schedule, the tug and the contract, but without continuous measurement the space is not visible at all. That is what ScanBarge shows the loader. Loading practice matters too. In the settling simulation of this barge in our demo portal (access follows a short call), a chute walking end to end at a steady rate puts 7,522 m³ on board; letting the load settle overnight and then topping it up fits 7,976 m³, about 6% more. The simulation was tuned on an earlier, larger settlement estimate, so treat that figure as an upper bound.
This is one load on one barge, in summer, with one chip supply. Species, moisture, chip size, chute placement and time at the dock will all change the numbers. We are adding loads to build a settlement curve rather than a single point. If you load or receive woodchips or other bulk material by barge and want to know what happens to your loads after the chute stops, book a call.
References
- Wästerlund, I., Nilsson, P. and Gref, R. (2017). Influence of storage on properties of wood chip material. Journal of Forest Science 63(4): 182–191. doi:10.17221/46/2016-JFS
- Enström, J., Eriksson, A., Eliasson, L., Larsson, A. and Olsson, L. (2021). Wood chip supply from forest to port of loading – A simulation study. Biomass and Bioenergy 152: 106182. doi:10.1016/j.biombioe.2021.106182
- McDonald, T.P., Stokes, B.J. and McNeel, J.F. (1995). Effect of product form, compaction, vibration and comminution on energywood bulk density. In Proceedings of the Workshop on Preparation and Supply of High Quality Wood Fuels, IEA/BA Task IX, Garpenberg, Sweden, pp. 6–23. USDA Treesearch 7321